online / offline analysis tool for BeCOMS and SiCOMS
Introduction


motcom loganalyser is a PC program for extended and detailed assessment of measurement data delivered by BeCOMS / BCom system during its operation.The software is capable of viewing SiCOMS / OCom system measurement data as well. Both BeCOMS / BCom and SiCOMS / OCom systems record the engine measurement data in daily (or hourly) logfiles on a connected PC. Reviewing and assessing this data is vital for evaluating engine condition and planning maintenance procedures.
motcom loganalyser advanced viewing tools for logfiles give an extended sight of the engine condition at a selected time point or time interval. In addition to this “offline” analysis, motcom loganalyser can be used as an “online” monitoring tool. Run as a background application parallel to BeCOMS / BCom and SiCOMS / OCom Logger software, it automatically registers new logfiles and detects changes in them. This long-time overview of engine status helps to forecast possible problems and plan necessary engine maintenance works more effectively.
Functional description
Main program window has a common Windows-style task bar with menus and large command buttons on the left side. These command buttons switch between the program functional sections: single file analysis, multiple file analysis and online monitoring.
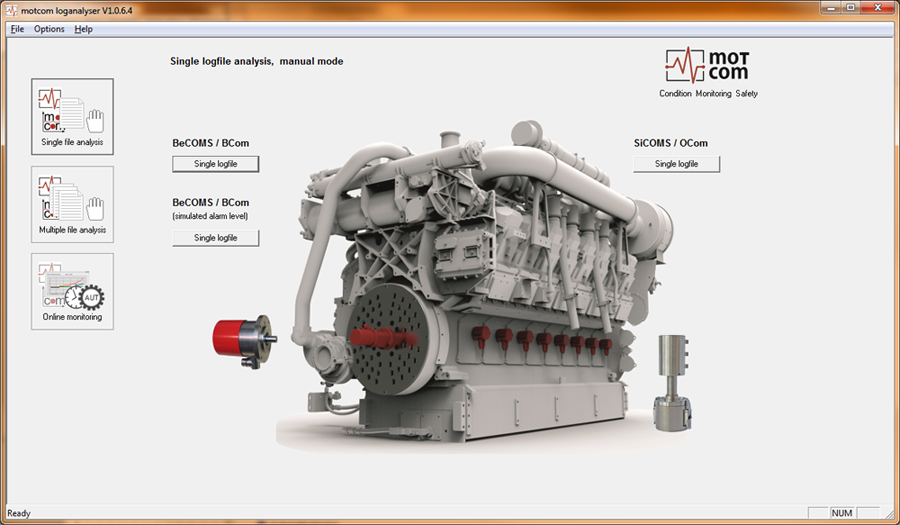
Single file analysis is the default panel (the corresponding command button is highlighted). It has command buttons for opening BeCOMS / BCom logfiles (also with simulated BCom alarm level), and for SiCOMS / OCom logfiles.
BeCOMS / BCom
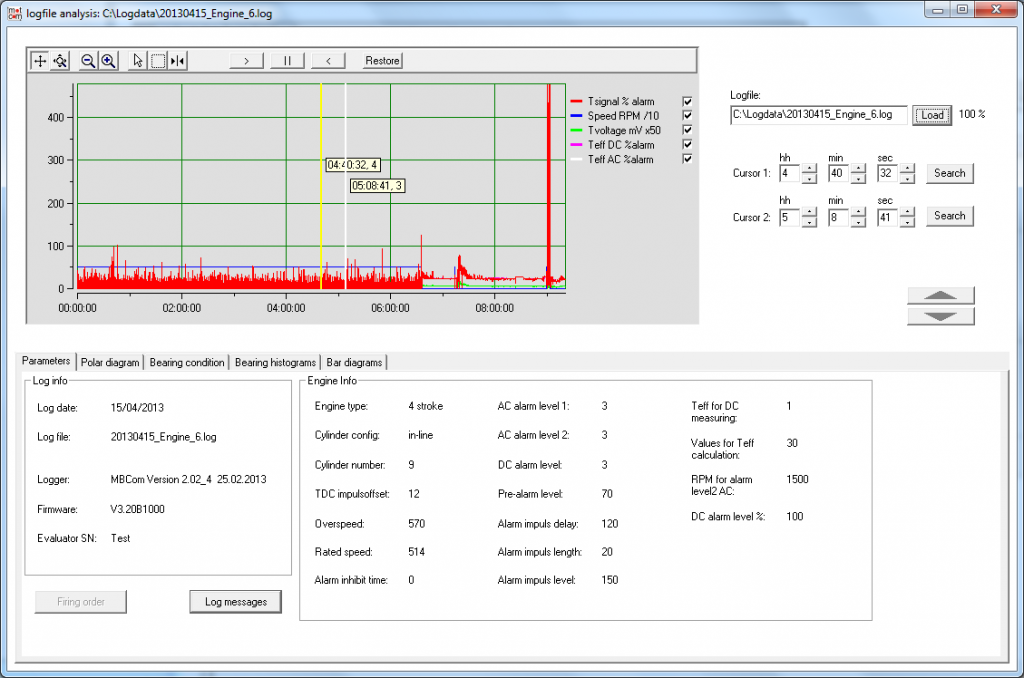
The graph at the upper part of the window shows the time diagram of the linear data. The diagram can be scrolled (to switch in scroll mode: button) and zoomed in and out (zoom mode: button). Click on x- or y-axis with the left mouse button, hold the button and move the mouse to scroll or zoom data.
Tab controls at the bottom part of the window present:
- engine and system parameters,
- polar data diagram,
- bearing condition indicator,
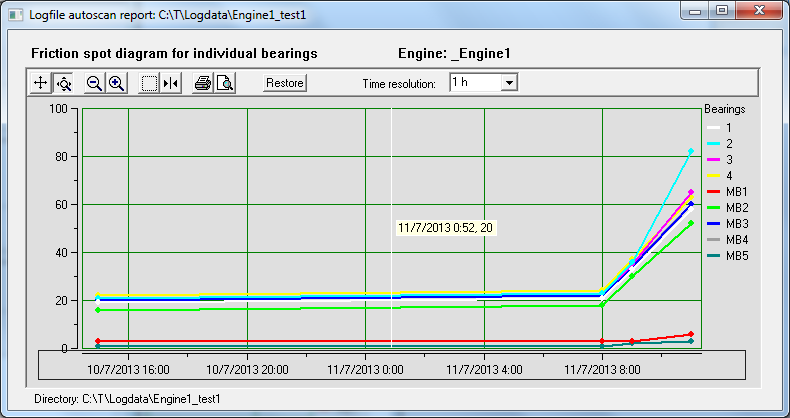
- bearing histograms of friction spots proportion to measured data over log time,
- bar diagrams for cylinder thermosignal and cylinder speed difference.
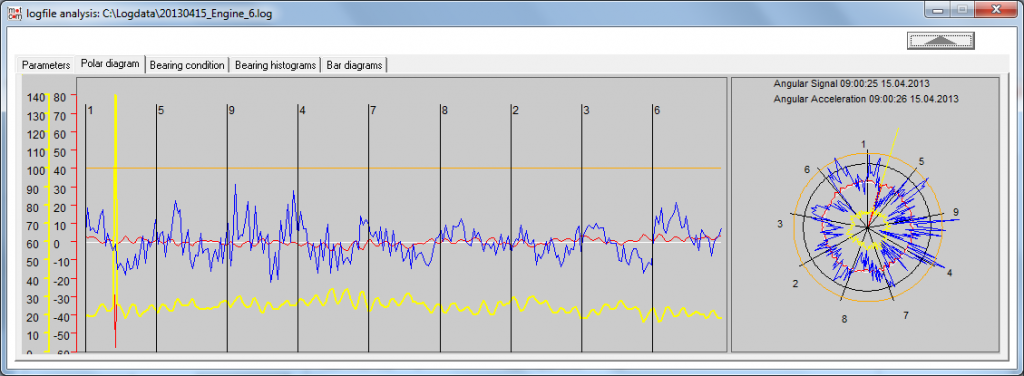
- displays polar data measured during the full combustion cycle nearest to the time point selected at the linear plot.
These are:- thermo voltage relative to the cycle mean value
- thermo voltage in persent to alarm level
- crankshaft angle acceleration
- 100% of thermosignal alarm level
The black radial lines (polar coordinates diagram) and vertical lines (xy-diagram) represent the firing order of engine cylinders. Polar data is only recorded into logfile while the engine runs while linear data is present even when the engine is stopped. The y-axis of polar xy-diagram can be scrolled. Put the mouse pointer on the y-axis scale, press the left mouse button and pull the scale up or down.
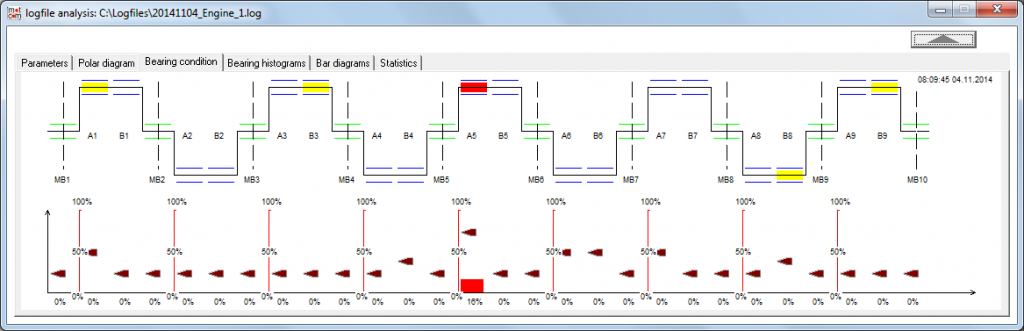
- the tab represents graphically the risks of friction spot appearing based on polar data.
upper: schematic model of the crankshaft with friction spots indicator. Blue lines show big end bearings, green lines correspond to main bearings. If relative thermosignal value in percent of DC alarm level in polar data at a selected time point reaches or exceeds 100%, and if it can be assigned to a bearing, the bearing is displayed as a red line, and a friction spot is registered for this bearing. If the relative thermosignal exceeds 70%, the corresponding bearing is displayed as a yellow line.
lower: each bar represents the maximal value of friction spots in percent to total data points registered for the bearing at a sample time interval between the two cursors at the linear diagram. The sliders show the maximal percentage of friction spots value in the complete polar data set of the logfile.
This can help to estimate the risk of bearing damage.
SiCOMS / OCom
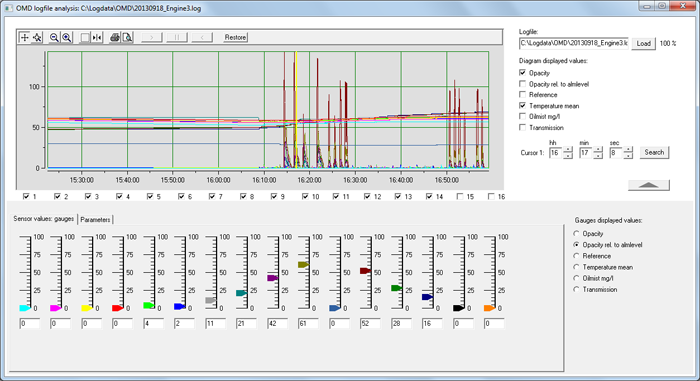
To open an OCom logfile for analysis, use Load button. Loading progress in percent is displayed to the right of it.
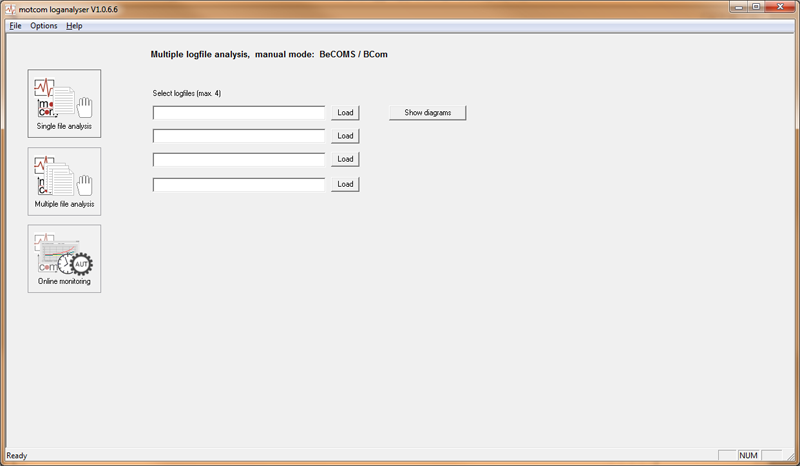
Multiple file analysis panel allows to load up to 4 BCom logfiles at the same time for comparing.
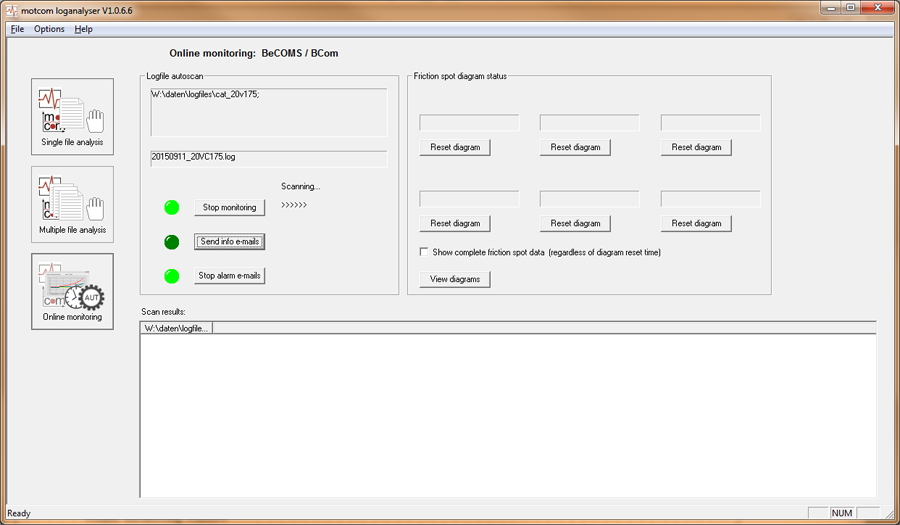
Online monitoring panel has a section that displays some relevant settings, f. i. paths to directories where logfiles are being stored, control buttons to start or stop monitoring processes, and also contains a short status report in text form.
The online monitoring window which is always present in the background during online mode use provides the autoscan function for long time analysis of data in logfiles.
The purpose of scanning is to detect high thermosignal values in polar data which could suggest presence of a friction spot in a bearing or other moving engine part. Every “peak” in thermovoltage signal that exceeds 100% of DC alarm level is counted, even if no alarm situation is detected. System status messages are also extracted from scanned logfiles.
It is possible to use autoscanning as a one-time routine or as a monitoring task performed regularly at a certain time interval, for instance parallel to BCom Logger. One-time scan routine extracts information from logfiles collected over a certain time period. Monitoring routine checks regularly for newly created logfiles and for changes in a logfile currently being written by BCom Logger, and adds this new information to existing autoscan results.
“Logfile autoscan” frame in the left upper corner shows:
- shows selected logfile directories to scan, and the name of the logfile currently being scanned, or autoscan status messages. To set up scan directories and scan mode, use Options / Logfile autoscan options menu
- contains control buttons and LED indicators of monitoring tasks (ON / OFF)
“Start monitoring” button – press it to start the online monitoring process. If continuous online monitoring is not selected in options window, the caption on the button is “Scan once”. After start, the button caption changes to “Stop monitoring” (or “Stop scanning”).
“Send info e-mails” button – press to start the background service for regular notification e-mails. After start, the button caption changes to “Stop sending”.
“Send alarm e-mails” button – if it is pressed, an e-mail containing short report (“alarm e-mail”) will be sent each time when new important system messages are detected. After start, the button caption changes to “Stop sending”.
The “Scan results” field contains information extracted from logfiles during scan: engine operating hours and number of system message occurrences: Main Alarm, Pre-Alarm, etc. Furthermore, the scan results are shown in form of cumulative diagrams in separate windows for each scanned directory:
“Friction spot diagram status” frame contains “Reset diagram” button and a text field showing the time of the latest reset for each selected directory.
If “Show complete friction spot data” checkbox is unchecked, only data from logfiles starting from the latest reset point will be included in scan results. Otherwise, data from all logfiles are shown
products
loganalyser flyer